- Grant: FC 015/2017
- Title: microRNA profiling in stool and plasma of subjects affected by celiac disease by Next-Generation-Sequencing.
- Duration: Triennial Project
- Principal Investigator: Dott. Antonio Francavilla, Italian Institute for Genomic Medicine (IIGM), Turin, Italy
- Tutor (Head Lab): Prof. Paolo Vineis, Italian Institute for Genomic Medicine, Turin, Italy
Publications originating from the Project
- Francavilla A, Gagliardi A, Piaggeschi G, Tarallo S, Cordero F, Pensa RG, Impeduglia A, Caviglia GP, Ribaldone DG, Gallo G, Grioni S, Ferrero G, Pardini B, Naccarati A. Faecal miRNA profiles associated with age, sex, BMI, and lifestyle habits in healthy individuals. Sci Rep. 2021 Oct 19;11(1):20645. doi: 10.1038/s41598-021-00014-1. PMID: 34667192; PMCID: PMC8526833. https://pubmed.ncbi.nlm.nih.gov/34667192/
- Francavilla A, Ferrero G, Pardini B, Tarallo S, Zanatto L, Caviglia GP, Sieri S, Grioni S, Francescato G, Stalla F, Guiotto C, Crocella L, Astegiano M, Bruno M, Calvo PL, Vineis P, Ribaldone DG, Naccarati A. Gluten-free diet affects fecal small non-coding RNA profiles and microbiome composition in celiac disease supporting a host-gut microbiota crosstalk. Gut Microbes. 2023 Jan-Dec;15(1):2172955. doi: 10.1080/19490976.2023.2172955. PMID: 36751856; PMCID: PMC9928459. https://www.ncbi.nlm.nih.gov/pmc/articles/PMC9928459/
Project rationale and aims
Celiac disease (CD) is a complex autoimmune disease treatable only with a rigorous lifelong gluten-free diet (GFD), even though its long-term effects have not been fully investigated. Thus, the research of biomarkers for CD diagnosis and monitoring of the GFD adherence and its effects could help its clinical management.
For this purpose, a relevant role could be played by small non-coding RNAs (sncRNAs), key post-transcriptional regulators of gene expression in many cellular systems including the most famous microRNAs (miRNAs). Despite miRNAs have central roles in several diseases, including those of the gastrointestinal tract, only few studies focused on their expression in CD. Several evidence associated specific nutrients intake and the expression of certain miRNAs in healthy individuals. In this respect, they could also highlight the impact of the GFD on CD subjects over the years. In parallel, many studies showed the association between gut microbiome dysbiosis and several gastrointestinal tract disorders, including CD. Fecal miRNAs directly regulate the expression of specific bacterial genes essential for maintaining the normal gut microbiota and vice versa, the host gut microbiome can influence fecal miRNA levels. All these findings suggest that the diet-microbiota-miRNA axis could be crucial for regulating the host gene expression. However, the GFD effect on the interplay between microbiome and host miRNAs is still unexplored.
Aims of this work were i) to explore miRNAs and other sncRNAs expression profiles and gut microbiome composition in CD treated patients (including those tested positive for anti-transglutaminase IgA (tCD-TG+) and those negative (tCD)) and healthy controls without dietary restriction; ii) to assess if duration of the GFD adherence influences sncRNA expression and gut microbiome composition; iii) to relate miRNA expression and microbial abundances in CD and to identify features based on miRNAs and/or microbial species.
Research plan and results obtained
Several faecal miRNAs showed a different expression in tCDs, and in particular in tCD-TG+. Target enrichment analyses showed that miRNAs expressed in tCD-TG+ are involved in biological processes linked to an inflammatory state. Interestingly, the expression levels of some miRNAs (miR-4533, miR-4279, miR-641-3p, miR-6505-3p, miR-139-3p and miR-6720-3p) significantly correlated with the length of GFD. Furthermore, other classes of sncRNA, mainly piRNA and tRNA, were also dysregulated only in the tCD-TG+ group. On the other hand, no significant differences were observed performing the analyses in plasma samples.
Gut microbiome composition analyses revealed a reduction of Bifidobacterium longum, Roseburia sp CAG 309, Ruminococcus bicirculans, Ruminococcus callidus and Eubacterium sp CAG 274 in tCDs vs controls, while Roseburia inulinivorans was more abundant in the same comparison. In the tCD-TG+ group four microbial species were more abundant (Veillonella aty, Veillonella tobetsuensis, Streptococcus sanguinis and Haemophilus parainfluenzae) while Firmicutes CAG 83 and Ruminococcus bicirculans were less abundant than in healthy controls. Also, H. Parainfluenzae and S. Sanguinis resulted negatively correlated with GFD duration. Functional profiling of the gut metagenomes highlighted a lower abundance of genes involved in starch metabolism.
Correlation analysis between miRNA levels and microbial abundances highlighted Prevotella copri as the bacteria related with the highest number of miRNAs (n=15), followed by Anaeromassilibacillus sp An250 (n=12), and R. bicirculans (n=10). Conversely, the most connected miRNA in the network was miR-632 (14 related species), followed by miR-4265 (n=9), and miR-7158-3p (n=8).
Finally, a classification analysis based on a machine learning approach was run integrating miRNA, microbiome and nutrient data. As results, a panel of different features based on the aforementioned data accurately discriminated the CD groups from controls.
Experimental design and methodologies
A total of 127 individuals (untreated CD (n=3), treated CD patients (tCD, n=60), with a group of them tested positive for anti-transglutaminase IgA (tCD-TG+, n=10) and sex/age matched healthy omnivorous subjects) were enrolled and signed an informed consent to participate in the study. For each of them, a sample of plasma, serum and feces was collected as well as two questionnaires concerning dietary and lifestyles habits. All the collected samples were immediately stored at -80° until RNA/DNA isolation. With the exception of those already clinically tested, for all other participants who provided a blood sample had levels of anti-transglutaminase IgA were measured.
Small RNA sequencing was run in stool and plasma samples to assess miRNA expression and shotgun metagenomics sequencing in stool to explore gut microbiome composition. The data obtained were analyzed and integrated with advanced bioinformatics approach.
Potential pitfalls and caveats
A limitation of this study is the small number of tCD-TG+ and untreated CD individuals recruited. Indeed, although we observed different expression levels for some of the identified DEmiRNAs as well as microbial abundances in the latter group, coherently with the treated CD, we could not include them in the main statistical analyses due to its limited size. Another limitation of the study is the lack of analysis also in a group of healthy individuals adhering to a GFD, which could have provided a more comprehensive overview of the GFD influence on miRNA expression and gut microbiome composition.
Conclusions and discussion
This work is the first faecal sncRNA characterization with a concomitant description of their gut microbiome composition, in treated CD individuals.
A distinct pattern of expression was observed for several fecal miRNAs in CD subjects vs controls, particularly for tCD-TG+. Some miRNAs were also affected by the length of GFD, supporting the role of long-term dietary changes in reprogramming the post-transcriptional regulatory network of intestinal cells which is reflected in stool samples. Interestingly, seven miRNAs were coherently altered in both tCD and tCD-TG+ compared to healthy subjects. This group of miRNAs may be related to molecular aspects associated with CD pathology and not necessarily to the GFD adherence.
Other sncRNA biotypes (piRNAs and tRNAs) were altered in the CD groups, with a marked up-regulation in tCD-TG+ suggesting that such molecules could have an unexplored role in the gene regulatory networks of CD and be modulated by GFD.
Gut microbiome investigation revealed a different abundance of bacteria in both CD groups compared to controls and the microbial metabolic functional profiling in tCD revealed a lower abundance of genes involved in the starch metabolism: this could be related to the GFD, including products with a different content of starch and carbohydrates. The correlations among miRNA levels and bacteria abundance provide interesting evidence on candidate host-microbial interactions involved in this disease. Notably, the integration of data from miRNome, microbiome and nutrient intake showed the potentiality to discriminate CD categories from controls. This suggests a high specificity of the identified markers characterizing, either the effect of a long-term GFD and the perturbation related to an inflammatory state of the gut.
In conclusion, we showed the modulation of the human miRNome and gut microbiome composition either on metabolic processes in CD subjects on a GFD or in inflammatory-related pathways, as a consequence of the not strict/short adherence to a GFD. Present data also provide novel evidence to improve the understanding on the role of sncRNAs in the host-microbial crosstalk in physiological and pathological conditions. An integrated analysis of fecal miRNA and gut microbiome signatures might provide insights for designing more accurate tests for monitoring of CD.
Figures

Figure 1. A) Workflow of the study. tCD, treated Celiac Disease; TG, transglutaminase 2. B) Box-Violin plots reporting the estimated daily intake of nutrients significantly different among the investigated groups. The nutrient intake was normalized on the daily intake of kilocalories estimated for each subject. Wilcoxon Rank-Sum test: *p<0.05; **p<0.01; ***p<0.001.
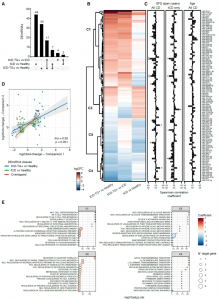
Figure 2. A) Upset plot reporting the number of differentially expressed miRNAs (DEmiRNAs) in each comparison. B) Heatmap of the log2 Fold Changes (log2FCs) of the DEmiRNAs. C1 to C4 labels depict four clusters from the hierarchical clustering analysis. C) Correlation analyses between DEmiRNA levels and years of GFD (all CD subjects, left, or tCD, middle), or subjects’age (right). *p<0.05; **p<0.01. D) Scatterplot relating the DEmiRNA log2FCs from the comparison between the CD groups and age- and sex-matched healthy controls (comparison 1) or an independent group of healthy controls (comparison 2). The color-code represents the comparison in which each DEmiRNA was detected. E) Dot plots showing the top 15 terms from the functional analysis of the DEmiRNAs belonging to the clusters reported in panel B. The dot size is proportional to the significance while the color-code refers to the RBiomirGS coefficient. Negative and positive coefficients are related to processes predicted to be, respectively down- and up-regulated based on the miRNA expression change.
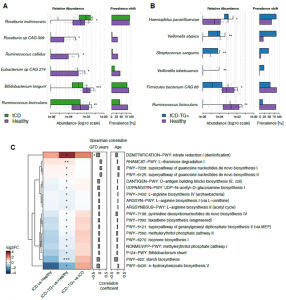
Figure 3. A-B) Plots showing the differentially abundant bacteria by comparing tCD (A) or tCD-TG+ (B) with healthy controls. For each study group on the left are reported the microbial relative abundances and on the right the prevalence shift. Wilcoxon Rank-Sum test: *adj.p<0.05; **adj.p<0.01; ***adj.p<0.001. C) Heatmap representing the log2FCs of microbial metabolic pathways associated with a significantly different prevalence among the comparisons performed. Wilcoxon Rank-Sum test: *p<0.05; **p<0.01. On the right are reported the correlation coefficients computed between the pathway prevalence and the years of GFD or CD subjects’ age: *p<0.05.
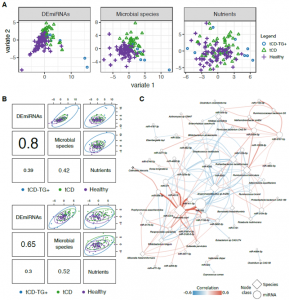
Figure 4. A) Sample plots from DIABLO analysis showing the contribution of stool DEmiRNAs, microbial species, or nutrients in distinguishing both CD categories and controls. The samples are represented as dots plotted according to their projection in the subspace spanned by the latent variables defined by integrating the three data types. B) Correlation between variate 1 (top) and variate 2 (bottom) defined for each data type. C. Network representation of the significant correlations (adj.p<0.05) between DEmiRNAs and bacteria identified as discriminating features in the DIABLO analysis. The node size is proportional to their degree, while edge color and width are related to the correlation coefficients.